
Contents
Use this when you have more tasks than capacity and need to decide what to do first. The Impact-Effort Matrix plots every initiative on two axes — expected impact and required effort — then sorts them into four quadrants that make the sequencing decision almost mechanical: quick wins first, big projects next, fill-ins if you have slack, and thankless tasks never.
Section 1
What This Tool Does
Every team has a backlog problem. Not a shortage of ideas — a surplus. Feature requests, process improvements, marketing experiments, technical debt, partnership opportunities, internal tooling. The list grows faster than the team can execute, and the question is never "what should we work on?" but "what should we work on first?" Left to intuition, that question gets answered by whoever talks loudest in the planning meeting, whatever the CEO mentioned on Tuesday, or whichever task happens to feel most urgent at 9 a.m. on Monday. None of these are prioritisation. They're drift with extra steps.
The Impact-Effort Matrix — sometimes called the 2×2 Priority Matrix, the Action Priority Matrix, or simply the effort-value grid — is the most stripped-down tool available for converting a chaotic backlog into a sequenced plan. You draw two axes. The vertical axis measures expected impact: revenue, user growth, cost reduction, strategic positioning, whatever metric matters most to the decision at hand. The horizontal axis measures effort: time, money, people, complexity, political capital. Every candidate initiative gets plotted on the grid. The result is four quadrants. Top-left: high impact, low effort — your quick wins, do these immediately. Top-right: high impact, high effort — your major projects, plan and resource these deliberately. Bottom-left: low impact, low effort — fill-ins, do these when you have idle capacity. Bottom-right: low impact, high effort — thankless tasks, kill these or deprioritise indefinitely.
That's the whole mechanism. No weighted scoring, no Monte Carlo simulation, no elaborate spreadsheet. The cognitive shift is forcing yourself to evaluate every initiative on exactly two dimensions simultaneously, rather than letting a single dimension — usually urgency or excitement — dominate the decision. Most prioritisation failures aren't failures of analysis. They're failures of comparison. Teams evaluate each initiative in isolation ("this seems important") rather than against every other initiative competing for the same resources. The matrix makes that comparison visual and unavoidable.
The tool's origins are diffuse — no single inventor, no founding paper. Variants appear in lean manufacturing, agile software development, and management consulting from the 1970s onward. The Eisenhower Matrix (urgent vs. important) is a close cousin, but it solves a different problem: personal time management. The Impact-Effort Matrix is about resource allocation across a portfolio of initiatives, which makes it a team tool, not a personal productivity hack. The distinction matters. When you're deciding how to spend your own afternoon, you can afford imprecision. When you're deciding how twelve engineers spend the next quarter, imprecision is expensive.
Section 2
How to Use It — Step by Step
Instructions on the left. Worked example — a Series B SaaS company with a product team of eight deciding which of twelve backlog items to tackle in Q2 — on the right.
Step 1 — Define
Clarify what 'impact' and 'effort' mean for this specific decision
This is where most teams skip ahead and pay for it later. "Impact" is not a universal concept. For a growth-stage startup, impact might mean net new ARR. For a platform team, it might mean reduction in incident frequency. For a marketing team, it might mean qualified pipeline generated. Pick one primary impact metric — two at most — and write it on the vertical axis. Do the same for effort: is it engineering-weeks? Total cost? Calendar time including dependencies? If you leave these undefined, every participant will score against their own private definition, and the resulting grid will be noise.
Worked example
SaaS product team — Q2 planning
The team defines impact as "expected incremental ARR within 6 months of launch" and effort as "engineering-weeks required, including QA and deployment." They write both definitions on the whiteboard before anyone touches a sticky note. The PM also clarifies: impact estimates should assume current sales capacity — no credit for revenue that requires a sales team they haven't hired yet.
Step 2 — List
Enumerate every candidate initiative without filtering
Get everything on the board. Feature requests, tech debt items, experiments, integrations, internal tools — anything competing for the same pool of resources. Don't evaluate yet. Don't debate whether something "belongs" on the list. If someone thinks it's a candidate, it's a candidate. The filtering happens in the next step. Premature filtering is how politically favoured projects skip the comparison process entirely.
Worked example
The backlog
Twelve items: (1) Self-serve onboarding wizard, (2) Salesforce integration, (3) Database migration to reduce query latency, (4) AI-powered usage analytics dashboard, (5) SOC 2 compliance certification, (6) Mobile-responsive redesign, (7) In-app NPS survey, (8) Custom reporting module, (9) Slack notification integration, (10) API rate-limit overhaul, (11) White-label option for enterprise, (12) Automated dunning emails for failed payments.
Step 3 — Score
Estimate impact and effort for each initiative independently
Use T-shirt sizing (S/M/L/XL) or a simple 1–5 scale for each axis. Precision is not the goal — relative positioning is. You're not trying to calculate that Initiative A will generate exactly $340K in ARR. You're trying to determine whether A is higher-impact than B and lower-effort than C. Have each team member score independently first, then discuss outliers where scores diverge by more than two points. Those disagreements are information — they usually reveal hidden assumptions about scope, dependencies, or customer willingness to pay.
Worked example
Scoring the twelve items
Each of the eight team members scores all twelve items on a 1–5 scale for both impact and effort. The averages: Self-serve onboarding (Impact 4.5, Effort 3.2), Salesforce integration (4.1, 3.8), Database migration (2.0, 4.5), AI analytics dashboard (3.8, 4.2), SOC 2 (3.5, 2.8), Mobile redesign (2.5, 3.5), NPS survey (2.2, 1.0), Custom reporting (4.0, 4.6), Slack integration (2.8, 1.2), API overhaul (1.5, 3.0), White-label (4.3, 4.8), Automated dunning (3.2, 1.3). A notable disagreement: the sales team scored Salesforce integration at 5.0 impact; engineering scored it 3.0. The discussion reveals that sales assumes the integration will close three specific enterprise deals in pipeline. Engineering isn't sure those deals are real. The PM commits to validating with the prospects before finalising the score.
Step 4 — Plot
Place each initiative on the 2×2 grid and read the quadrants
Draw the matrix. Place each initiative according to its scores. The quadrant boundaries don't need to be at the exact midpoint — adjust them based on your team's capacity and ambition. A team with limited bandwidth might draw the "high effort" line at 3.0 instead of 3.5, effectively raising the bar for what qualifies as a major project. Once everything is plotted, the four quadrants tell you the sequence: Quick Wins (high impact, low effort) → execute immediately. Major Projects (high impact, high effort) → plan, resource, and schedule. Fill-Ins (low impact, low effort) → do when there's slack. Thankless Tasks (low impact, high effort) → deprioritise or kill.
Worked example
Reading the grid
Quick Wins (top-left): Automated dunning emails (3.2 impact, 1.3 effort) and SOC 2 compliance (3.5 impact, 2.8 effort). Major Projects (top-right): Self-serve onboarding (4.5, 3.2), Salesforce integration (4.1, 3.8), White-label (4.3, 4.8), Custom reporting (4.0, 4.6). Fill-Ins (bottom-left): NPS survey (2.2, 1.0), Slack integration (2.8, 1.2). Thankless Tasks (bottom-right): Database migration (2.0, 4.5), Mobile redesign (2.5, 3.5), API overhaul (1.5, 3.0), AI analytics dashboard (3.8, 4.2 — borderline, discussed further). The AI dashboard sits near the quadrant boundary. The team debates and decides it's a Major Project worth scheduling for late Q2, contingent on the onboarding wizard shipping on time.
Step 5 — Commit
Convert the grid into a sequenced roadmap with owners and timelines
The matrix is a sorting tool, not a plan. Translate it: Quick Wins get assigned to individuals or pairs with a two-week delivery target. Major Projects get scoped, broken into milestones, and assigned to pods. Fill-Ins go on a "grab when free" list. Thankless Tasks get explicitly communicated as "not doing this quarter" — stakeholders who requested them deserve to know, and the team deserves the psychological relief of a closed door. Revisit the grid at the start of next quarter. Effort and impact estimates change as the business evolves.
Worked example
Q2 roadmap
Weeks 1–2: Ship automated dunning emails (one engineer, estimated $18K/month recovered revenue). Begin SOC 2 documentation (PM + one engineer part-time). Weeks 3–8: Self-serve onboarding wizard (three engineers, full sprint). Weeks 6–12: Salesforce integration (two engineers, starting after onboarding reaches beta). Fill-in list: NPS survey and Slack integration — any engineer who finishes a sprint early grabs one. Explicitly deprioritised: Database migration, mobile redesign, API overhaul. The PM emails the stakeholders who requested the mobile redesign explaining the decision and the reasoning. White-label and custom reporting are deferred to Q3 planning.
Section 3
When It Works Best
✓
Ideal Conditions for the Impact-Effort Matrix
| Dimension | Best fit |
|---|---|
| Backlog size | 8–30 candidate initiatives. Fewer than eight and the prioritisation is obvious — just do them in order. More than thirty and the scoring process becomes unwieldy; pre-filter with a rough triage before running the matrix. |
| Decision type | Resource allocation across a portfolio of independent or loosely coupled initiatives. The tool assumes you can do items in any order. If initiatives have hard dependencies (B can't start until A ships), map those dependencies first, then use the matrix to sequence within each dependency tier. |
| Estimation confidence | Works best when the team has reasonable intuition about both impact and effort — even if imprecise. A product team that has shipped similar features before can T-shirt-size effort reliably. A team entering a completely new domain where every estimate is a guess will produce a grid that looks precise but isn't. |
| Stakeholder alignment | Particularly valuable when multiple stakeholders are competing for the same engineering or operational capacity. The visual grid depersonalises the prioritisation: it's not "your request lost to their request" — it's "your request is in the bottom-right quadrant." The matrix absorbs political heat that would otherwise land on the decision-maker. |
| Planning cadence | Quarterly or sprint-level planning where the team needs to commit to a fixed set of deliverables. The matrix is a batch-sorting tool — it works at planning boundaries, not in continuous flow. For real-time prioritisation of incoming requests, you need a different mechanism (weighted scoring, stack ranking, or a simple FIFO queue with override rules). |
| Reversibility | Most useful when the initiatives being prioritised are reversible or adjustable. If you sequence wrong and start with a Quick Win that turns out to be lower-impact than expected, you can course-correct next sprint. For irreversible, bet-the-company decisions, the matrix is too blunt — use a Decision Matrix or Scenario Planning instead. |
Section 4
When It Breaks Down
⚠
Failure Modes
| Failure pattern | What goes wrong | What to use instead |
|---|---|---|
| Impact conflation | The team never defines what "impact" means, so each person scores against a different metric — revenue, user satisfaction, strategic positioning, technical elegance. The resulting grid is an average of incommensurable judgments. Initiatives that score well on one dimension and poorly on another land in the middle of the grid, looking mediocre, when they might be the most important thing on the board. | Define impact explicitly before scoring. If multiple impact dimensions matter, run separate matrices or use a weighted Decision Matrix. |
| Effort underestimation on "quick wins" | Teams systematically underestimate effort on items they want to do. A "quick win" that was scored as 1.5 effort turns into a 4.0 once someone actually scopes it. The quadrant placement was wrong from the start, but by the time the team discovers this, they're committed and sunk-cost bias keeps them going. | Require a brief scoping exercise (half-day spike) for any Quick Win before it enters the sprint. If the effort estimate changes materially, re-plot it. |
| Ignoring dependencies | The matrix treats every initiative as independent. In reality, Initiative C might unlock the impact of Initiatives D and E. A database migration that scores as low-impact on its own might be the prerequisite for three high-impact features. Plotting it in the Thankless Tasks quadrant and killing it could block your entire roadmap. | Map dependencies before plotting. Score "enabling" initiatives based on the aggregate impact they unlock, not their standalone value. |
| Strategic blindness | The matrix optimises for near-term return on effort. It has no mechanism for weighing long-term strategic value, competitive moats, or optionality. A team that only does Quick Wins will ship a lot of small improvements and never build anything defensible. The grid rewards incrementalism. | Reserve a fixed percentage of capacity (20–30%) for Major Projects regardless of what the matrix says. Use Scenario Planning or Second-Order Thinking to evaluate strategic bets that the matrix would deprioritise. |
| Anchoring on first placement | Once an initiative is placed on the grid, it rarely moves. New information — a competitor launching a similar feature, a key customer threatening to churn — should change the impact score, but the visual permanence of the sticky note creates inertia. The grid becomes a snapshot that outlives its accuracy. | Re-run the matrix every planning cycle. Treat last quarter's grid as expired, not as a starting point. |
| False precision from averaging | Averaging individual scores smooths out the disagreements that contain the most useful information. If three people score an initiative at 5 impact and three score it at 1, the average of 3 tells you nothing. The disagreement tells you everything — there's a fundamental assumption gap that needs to be resolved before the initiative can be meaningfully prioritised. | Flag any initiative where individual scores diverge by more than 2 points. Discuss the divergence before accepting the average. Often the resolution changes the score dramatically. |
The most dangerous failure mode is strategic blindness — and it's structural, not accidental. The Impact-Effort Matrix is a greedy algorithm. It optimises locally: maximum return per unit of effort, right now. That's exactly the logic that leads a SaaS company to ship twelve small integrations instead of building a platform layer, or a consumer brand to run forty A/B tests on button colours instead of rethinking the core value proposition. Quick wins are seductive precisely because they deliver measurable results on short timescales. The matrix makes them even more seductive by giving them a flattering quadrant label.
The protection is simple but requires organisational discipline: never let the matrix allocate 100% of your capacity. Treat the Quick Wins quadrant as a source of 40–60% of your roadmap. The rest should come from deliberate strategic bets — Major Projects that the matrix correctly identifies as high-effort but that build capabilities, moats, or market positions that compound over years. The matrix can tell you those projects are expensive. It cannot tell you they're not worth it.
Section 5
Visual Explanation
Impact-Effort Matrix — populated with the SaaS product team's Q2 backlog. Quadrant labels indicate the action each category demands.
Section 6
Pairs With
The Impact-Effort Matrix sorts initiatives by return on effort. But sorting is only one step in a prioritisation process. What you sort, how you estimate, and what you do with the sorted list all benefit from complementary tools.
Use before
Issue Trees
Before you can prioritise initiatives, you need to generate them. Issue Trees decompose a strategic objective ("grow ARR by 40%") into mutually exclusive, collectively exhaustive sub-problems, each of which becomes a candidate initiative for the matrix. Without this step, the backlog is whatever people remembered to mention — not a systematic inventory of what could move the needle.
Use before
Pareto Analysis
If your backlog has fifty items, the matrix becomes unwieldy. Pareto Analysis identifies the 20% of problem areas or opportunity spaces that account for 80% of the potential value. Use it to pre-filter the backlog down to a manageable set of 10–20 candidates before plotting them on the grid.
Use after
Pre-Mortem
You've selected your Quick Wins and Major Projects. Before committing resources, run a Pre-Mortem on the top two or three: "It's six months from now and this initiative failed. What happened?" This catches effort underestimation, hidden dependencies, and market risks that the matrix's simple two-axis scoring can't surface.
Use after
RACI Matrix
The Impact-Effort Matrix tells you what to do and in what order. RACI tells you who does what. For Major Projects especially, unclear ownership is the most common reason a well-prioritised initiative stalls. Assign Responsible, Accountable, Consulted, and Informed roles immediately after the prioritisation session.
Mental model
Second-Order Thinking
The matrix captures first-order impact: "this feature will generate X revenue." Second-Order Thinking asks what happens next. A Quick Win that cannibalises a Major Project's value. A Thankless Task that, if left undone, creates compounding technical debt. The matrix scores the immediate; second-order thinking scores the cascade.
Mental model
Eisenhower Matrix
The Eisenhower Matrix (urgent vs. important) is the personal-productivity cousin of the Impact-Effort Matrix. Use Eisenhower for your own daily task list. Use Impact-Effort for team-level resource allocation. The two tools solve adjacent problems at different scales, and confusing them — applying urgency logic to portfolio decisions — is a common and costly mistake.
Section 7
Real-World Application
Spotify — Squad prioritisation and the 'bet' framework
The scenario
By 2013, Spotify's engineering organisation had scaled to dozens of autonomous squads, each responsible for a slice of the product. Autonomy was the point — squads could ship without waiting for centralised approval. But autonomy created a coordination problem: with each squad maintaining its own backlog, there was no mechanism to ensure that the highest-impact work across the entire company was getting resourced first. Some squads were polishing low-impact features while critical infrastructure work sat unowned. Henrik Kniberg, Spotify's agile coach, documented how the company adapted prioritisation frameworks — including impact-effort grids — to work within their squad model.
How the tool appliedSpotify's approach was to run impact-effort prioritisation at two levels. At the squad level, each team plotted their own backlog items on a 2×2 grid during sprint planning, using squad-specific definitions of impact (often tied to a squad-level OKR) and effort (engineering days). At the tribe level — a collection of related squads — tribe leads ran a quarterly "betting table" where the highest-impact initiatives from each squad's Major Projects quadrant competed for shared resources, temporary staffing loans, or cross-squad collaboration. The tribe-level matrix used company-wide impact metrics (monthly active users, conversion rate, streaming hours) rather than squad-level proxies.
What it surfacedThe two-level approach revealed a pattern that a single matrix would have missed: squads consistently overvalued squad-specific impact and undervalued platform-level impact. A squad responsible for playlist features would rate a playlist improvement as high-impact because it moved their OKR. But at the tribe level, the same initiative competed against an audio quality improvement that affected every user, not just playlist users. The tribe-level matrix repeatedly elevated infrastructure and platform work that individual squads had deprioritised — work that was high-effort at the squad level but high-impact at the company level. This is the dependency and strategic blindness problem in action, and Spotify's solution was structural: run the matrix at multiple altitudes.
The non-obvious factorWhat made Spotify's application distinctive was the explicit separation of "impact for whom." Squad-level impact and company-level impact are different metrics, and a single matrix that conflates them will systematically under-resource platform work. Kniberg's insight — documented in his widely circulated internal presentations and later published essays — was that the Impact-Effort Matrix is only as good as the altitude at which you define impact. Run it too low and you optimise locally. Run it only at the top and you lose the squad-level context that makes effort estimates accurate. The answer is both: local matrices for execution sequencing, rolled up into a portfolio matrix for strategic allocation.
Section 8
Analyst's Take
Faster Than Normal — Editorial View
The Impact-Effort Matrix is the most widely used prioritisation tool in product management, and probably the most widely misused. Its power is real: it forces comparison across a portfolio, it makes the tradeoff between ambition and feasibility explicit, and it gives teams a shared visual language for saying "no" to low-value work. Its danger is equally real: it flatters incrementalism. A team that faithfully executes every Quick Win and never tackles a Major Project will ship a lot of small things, hit their sprint velocity targets, and slowly become irrelevant. The matrix doesn't tell you this is happening. It tells you you're being efficient.
The failure mode I see most often is what I'd call "effort inflation on strategic work." Teams unconsciously — or consciously — inflate the effort score on initiatives they find risky or unfamiliar, pushing them into the Major Projects or Thankless Tasks quadrant where they can be safely deferred. Meanwhile, comfortable, well-understood work gets scored as low-effort and lands in Quick Wins. The grid ends up reflecting the team's comfort zone, not the company's strategic priorities. The tell: if your Quick Wins quadrant is full and your Major Projects quadrant is empty quarter after quarter, you're not prioritising. You're avoiding.
The highest-leverage modification is brutally simple: score impact and effort separately, with different people. Have the commercial team (sales, marketing, customer success) score impact. Have the delivery team (engineering, design, ops) score effort. Neither group sees the other's scores until both are complete. Then plot the combined result. This eliminates the most pernicious bias in the standard process — the tendency for the people who will do the work to unconsciously adjust their effort scores based on how much they want to do the work. Separating the scoring surfaces honest disagreements about value and cost that a single-team session papers over. It takes thirty extra minutes. It changes the roadmap every time.
Section 9
Top Resources
01
Book
The best practical guide to product prioritisation in a technology context. Cagan doesn't dedicate a chapter to the Impact-Effort Matrix specifically, but his frameworks for opportunity assessment and roadmap construction are built on the same logic: evaluate every initiative against impact and cost before committing resources. Read Part III for his approach to prioritisation within empowered product teams — the organisational context that makes the matrix actually work.
02
Book
Olsen provides one of the clearest published walkthroughs of the Impact-Effort Matrix as a product prioritisation tool, including how to define scoring criteria, facilitate the team session, and translate the grid output into a sprint plan. Chapter 11 covers the matrix directly. Particularly useful for teams running the tool for the first time and wanting a step-by-step facilitation guide.
03
Book
The Impact-Effort Matrix requires a clear definition of "impact," and OKRs are the most widely adopted framework for making that definition explicit at the company, team, and individual level. Doerr's account of how Intel and Google used Objectives and Key Results provides the upstream context that makes the matrix's impact axis meaningful rather than subjective. Without clear OKRs, impact scoring devolves into opinion.
04
Book
The strategic blindness problem — the matrix's tendency to reward incrementalism over transformative bets — is fundamentally a strategy problem. Lafley and Martin's "where to play / how to win" framework provides the strategic guardrails that prevent the matrix from optimising you into irrelevance. Read this to understand which Major Projects deserve protection from the Quick Wins quadrant's gravitational pull.
05
Book
The cognitive biases that make the Impact-Effort Matrix necessary — and the cognitive biases that corrupt it. Kahneman's work on the planning fallacy (systematic effort underestimation), anchoring (first scores influencing all subsequent scores), and WYSIATI ("what you see is all there is," which explains why teams only prioritise what's already on the backlog) provides the psychological foundation for understanding both why the tool works and how it fails. Essential reading for anyone facilitating prioritisation sessions.
Decision Tools Library — Browse by phase
Why this matters next
mental modelsSecond-Order Thinking
Issue Trees applied the Second-Order Thinking mental model
mental modelsLeverage
Issue Trees applied the Leverage mental model
mental modelsCompounding
Issue Trees applied the Compounding mental model
mental modelsTechnical Debt
Issue Trees applied the Technical Debt mental model
mental modelsInertia
Issue Trees applied the Inertia mental model
mental modelsScale
Issue Trees applied the Scale mental model
Continue exploring
Free playbook
Get The Business Model Playbook
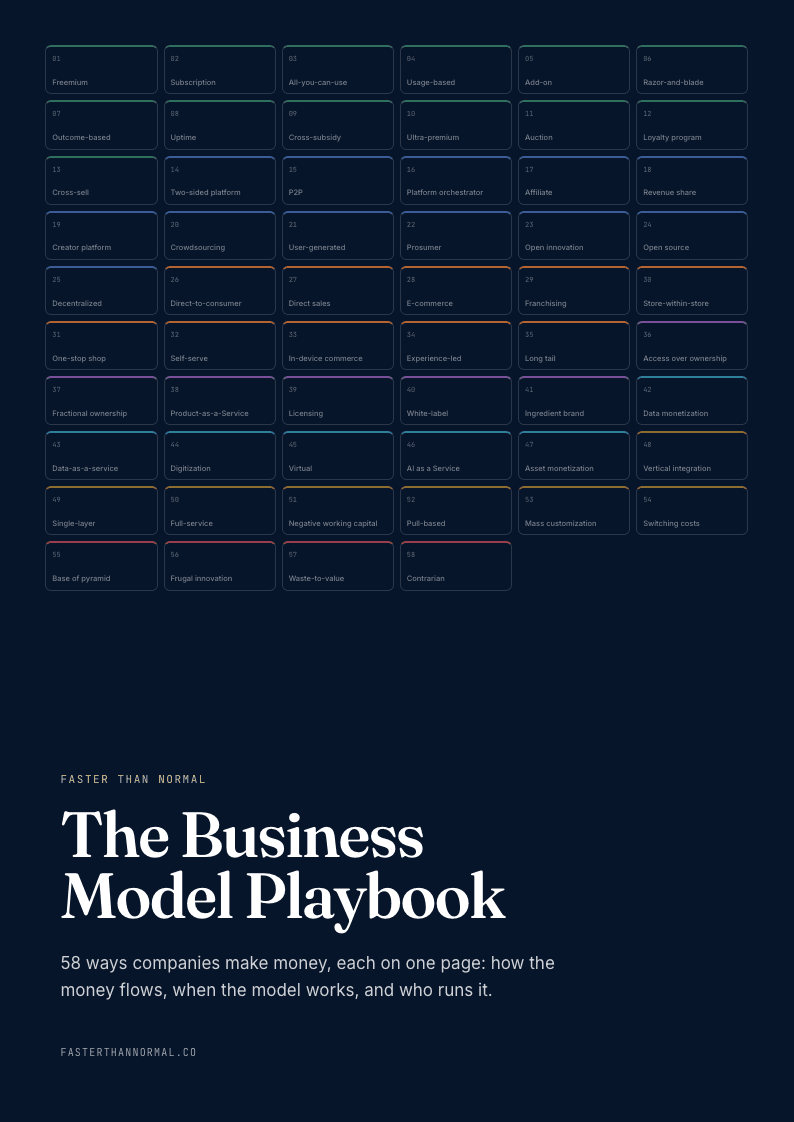
58 business models, one visual page each: how the money flows, the metrics that matter, and who runs it. Free when you join the Faster Than Normal email.
Free. No spam. Unsubscribe anytime.